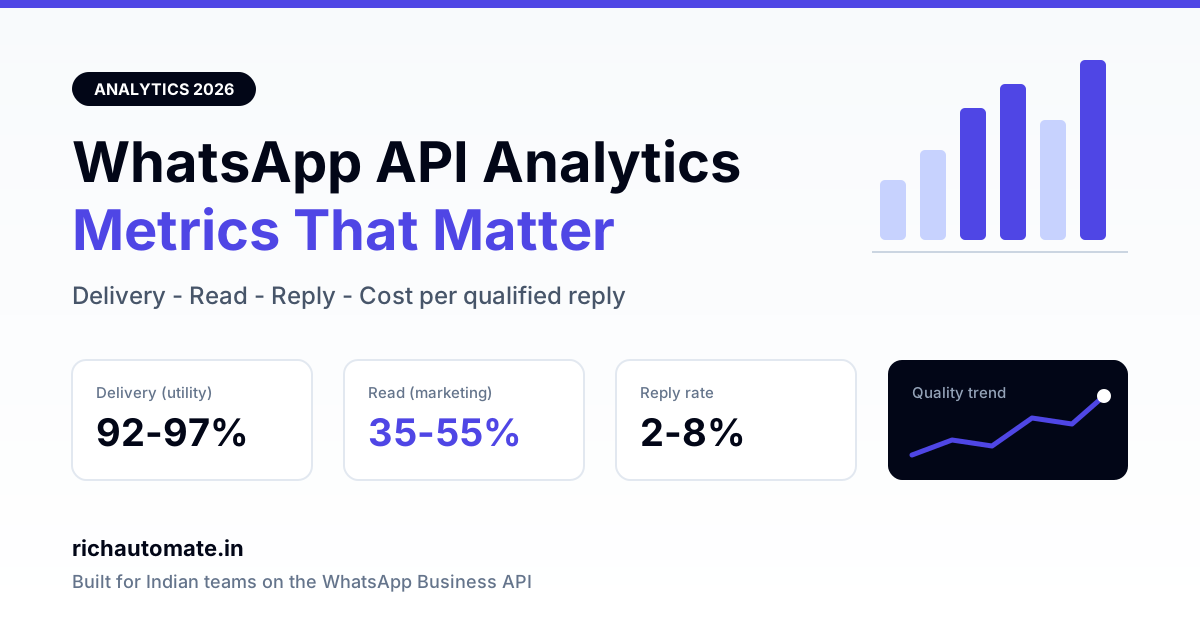
The WhatsApp Business API metrics that actually decide anything for an Indian team in 2026 are five: delivery rate, read rate, reply rate, cost per qualified reply, and the direction your quality rating is moving. Everything else on a typical dashboard is vanity — total messages sent, "reach", template counts and raw open volumes tell you how busy you were, not whether the channel is working. This guide explains what each number should look like across Indian tenants, how to read a bad one, and which charts you can safely ignore forever.
The five metrics that change a decision
A metric earns its place on a dashboard only if a bad value forces you to do something different tomorrow. By that test most WhatsApp reporting fails. Sent volume goes up when you send more; it never tells you to stop. Delivery rate, by contrast, has a clear failure mode and a clear fix.
Here is the short list we keep on the default reporting view, and what each one is really measuring:
- Delivery rate — did Meta actually hand the message to the device? This is your infrastructure and list-hygiene signal.
- Read rate — did a human open it? This is your timing, sender-identity and template-preview signal.
- Reply rate — did a human respond? This is your offer and copy signal, and the only one that opens a service window.
- Cost per qualified reply — what did one useful conversation cost, including the messages that went nowhere? This is your economics signal.
- Quality rating trend — is Meta's opinion of your number getting better or worse over the last three sends? This is your survival signal.
Notice that four of the five are ratios and one is a direction. Absolute counts appear nowhere. That is deliberate: a count tells you about your activity, a ratio tells you about your audience, and a trend tells you about your risk.
Vanity versus decision metrics
The fastest way to clean up a WhatsApp dashboard in an Indian business is to move most of its tiles into a second "activity" tab nobody opens during a review. This table is the split we use.
| Vanity metric | Why it misleads | Decision metric to use instead |
|---|---|---|
| Total messages sent | Rises purely with budget; a bad campaign and a good one both look busy | Cost per qualified reply |
| Contacts reached | Counts accepted-by-Meta, not seen-by-human | Delivery rate, then read rate |
| Template approval count | Approval is a permission, not a performance | Per-template read and reply rate |
| Open rate as a single number | Mixes utility and marketing, which behave nothing alike | Read rate split by category |
| Campaign completion percentage | Tells you the queue drained, not that anyone cared | Throughput-adjusted delivery within the send window |
| Chatbot sessions started | Counts entries, including accidental and abandoned ones | Flow completion rate to the step that matters |
| Total opt-ins collected | An unengaged list is a quality-rating liability | Active-90-day opted-in contacts |
One nuance Indian teams hit constantly: a single blended "open rate" across utility and marketing is close to meaningless, because the two categories are opened by different people for different reasons. An order-shipped utility message gets opened because the customer is waiting for it. A festive offer gets opened because the preview line was interesting. Blending them produces a number that never moves enough to be actionable.
Benchmarks from our own Indian cohort
The numbers below are what we observe across Indian tenants on RichAutomate — retail, education, clinics, real estate, D2C and local services — sending to Indian mobile numbers. They are ranges, not guarantees, and your own baseline matters more than ours. Treat them as a sanity check: if you are far outside a band, something specific is usually wrong rather than "the channel being bad".
| Metric | Healthy range (our cohort) | What a bad number usually means | First fix to try |
|---|---|---|---|
| Delivery rate — utility | 92-97% | Bad numbers in the list, wrong country-code formatting, or a messaging-limit ceiling | Normalise to E.164, drop hard-failed numbers, check your tier |
| Delivery rate — marketing | 78-88% | Stale list, per-user marketing caps, or pacing too aggressive for your tier | Suppress 180-day inactives, slow the send |
| Read rate — utility | 70-85% | Sent at a time nobody checks, or the preview line is a wall of variables | Front-load the useful fact in the first line |
| Read rate — marketing | 35-55% | Generic offer, unrecognised sender, or fatigue from over-sending | Cut frequency, fix the display name, segment |
| Reply rate — marketing | 2-8% | No clear single action, or a link that pushes the user out of WhatsApp | Ask one question, add quick-reply buttons |
| Block + report rate | Under ~0.5% of delivered | Consent is weak or the audience never expected you | Stop the campaign, re-check opt-in source |
| Flow completion | 45-70% to the key step | Too many steps, or a dead end with no fallback branch | Cut steps, wire a no-match fallback |
Two caveats worth stating plainly. First, read receipts only exist for users who leave them enabled, so read rate is a floor, not a census — a real share of Indian users switch them off, and that share is not something we can measure precisely. Second, seasonality is brutal here: festive weeks, exam results, board announcements and quarter-end all move these bands, so compare a Diwali send to last Diwali, not to a quiet Tuesday in August.
Cost per qualified reply: the only economics metric you need
Most WhatsApp reporting stops at cost per message, which is the least interesting number in the stack because it barely varies. What varies enormously is how many messages it took to get one conversation worth having.
Define "qualified reply" narrowly and in writing before you measure it — a reply that contains an actual intent (a question, a size, a date, a budget, a yes), not "ok", not a sticker, not an unsubscribe. Then the arithmetic is simple: total spend on the campaign divided by the count of qualified replies. That single number lets you compare a ₹1.20 marketing blast against a ₹0.30 utility nudge honestly, because it prices in the waste.
Why utility and marketing must be costed separately
On RichAutomate the pricing is usage-only — ₹0 setup, ₹0 monthly platform fee — and you pick the model that fits how you operate. On Client Pay the platform charge is ₹0.10 per message, and on SaaS Pay it is ₹1.20 per marketing message and ₹0.30 per utility message. Because marketing and utility cost different amounts and convert at different rates, blending them into one "cost per lead" number hides which one is actually carrying the business.
| Scenario | Message category | Typical reply behaviour | What the report should show |
|---|---|---|---|
| Order shipped, payment reminder, appointment confirm | Utility | High read, low reply — people read and act, they do not chat | Read rate and downstream action, not reply rate |
| Festive offer, new-collection drop, re-engagement | Marketing | Lower read, replies concentrated in the first two hours | Cost per qualified reply, plus block rate as a guardrail |
| Abandoned-cart or form follow-up inside the window | Service window | Highest reply rate of the three | Window utilisation — how many opened windows you actually used |
That third row is the one most Indian teams under-report. Once a customer replies, you have a service window in which conversation is cheap. If your dashboard never shows how many opened windows expired unused, you are leaving your cheapest conversations on the floor. Add a single tile: windows opened this week versus windows in which a human or bot actually said something useful.
Get a 1-minute BSP audit on WhatsApp
Drop your WhatsApp number — we line-item your current invoice against Meta India rates in under 60 seconds. India-hosted, DPDP-compliant.
Reading quality rating as a trend, not a status
Quality rating is the metric people check only after it turns amber, which is exactly too late. It is best read as a direction over your last several sends, correlated against what you changed. A rating that drops the day after you added a new list source is not a mystery; it is an answer.
Practical rules we apply across tenants:
- Log every send with its audience source, template, and send time, so a rating dip has candidate causes attached.
- Watch block-and-report rate per campaign, not per account — the account average hides the one bad segment.
- Treat a rating change as a reason to pause and inspect, not to send the same thing to a smaller group.
- Remember that rating and messaging capacity interact: a fall in standing can pull your throughput down with it. Our guide to WhatsApp messaging limits and tier progression in India covers how that ceiling moves.
If the rating has already gone red, the recovery path is a specific sequence rather than a wait-and-see — we wrote it up in detail in recovering a red WhatsApp quality rating. The reporting lesson is the same either way: a status light you glance at is worthless, a seven-day trend line with annotations is a control system.
Attribution without lying to yourself
WhatsApp attribution in India is genuinely hard because the conversation often ends in a phone call, a store visit, or a UPI payment made outside any tracked flow. Two honest approaches beat one dishonest model.
Hold out a control group
The most reliable measurement you can run costs you nothing but discipline: exclude a random slice of the eligible audience from the campaign and compare their conversion to the treated group over the same window. This survives every attribution argument, because it measures lift rather than correlation. Ten percent held back on a large list is usually enough to see a real effect.
Ask, and record the answer
A single structured question in the flow — "how did you hear about us" with buttons — captures the self-reported source that no pixel will ever see. It is imperfect and people misremember, but on a WhatsApp-heavy funnel it consistently surfaces the dark-social traffic that analytics tools attribute to "direct".
What we would avoid is building an elaborate last-click model on top of click-tracked links alone. Link clicks undercount badly on WhatsApp because a meaningful share of Indian users read the message, remember the offer, and arrive through search or the app later.
Template and operational reporting
Comparing templates properly
Per-template read and reply rates are the most actionable breakdown on any WhatsApp dashboard, and also the easiest to misread. Two templates sent to different segments at different hours are not comparable, no matter how different the numbers look. If you want to learn something transferable, run the comparison as an actual split on one audience — the methodology, sample sizes and stopping rules are covered in our write-up on A/B testing WhatsApp templates in India.
A few reporting habits that make template data trustworthy:
- Version your templates in the name, so a rewritten template does not silently inherit the old one's history.
- Report per-template numbers with an absolute denominator visible; a 60% read rate on 40 sends is noise.
- Separate the button-click rate from the reply rate — a quick-reply tap and a typed message mean different things about intent.
- Keep a graveyard of retired templates and their final numbers, so you stop re-testing ideas that already failed.
Operational metrics your team actually feels
Campaign analytics get the attention, but the numbers that determine whether your WhatsApp desk is pleasant to work on are operational. First-response time inside the service window, median conversation resolution time, share of conversations handled by automation without a handoff, and queue depth at peak hour. These are staffing decisions, and they are invisible on a marketing dashboard.
Throughput deserves a tile of its own if you send in bursts. A campaign that Meta accepted over six hours instead of thirty minutes changes what "sent at 10am" even means, and it interacts with everything downstream — read rates collapse when your festive offer lands at 4pm. The engineering side of that is in our piece on WhatsApp campaign throughput engineering.
For teams with more than a couple of operators, add one more: who sent what. Not for surveillance, but because the single most expensive WhatsApp incidents we see are a wrong list attached to the right template, and without a per-user action trail nobody can reconstruct what happened. The practical setup is described in our note on WhatsApp API audit logs.
What to ignore, permanently
Some charts consume review time and return nothing. In our experience these are safe to delete:
- Hour-of-day heatmaps built on small volumes. Below a few thousand messages per cell they are drawing patterns out of noise.
- Sentiment scores on Hinglish conversations. Generic sentiment models handle code-mixed Indian text poorly, and a wrong score is worse than no score.
- Average response time across all conversations. One overnight outlier destroys the mean; use the median and the 90th percentile.
- Month-over-month comparisons across a festival boundary. Compare like periods or do not compare.
- Cumulative "total contacts" counters. They only ever go up, so they can never signal a problem.
- Per-message cost as a headline. It is fixed by your plan; see the usage-only WhatsApp API pricing for what actually varies.
A weekly review that takes fifteen minutes
Reporting only pays off if someone reads it on a schedule. The routine we recommend to Indian teams is short and fixed, which is why it survives.
- Minute 1-3: Quality rating trend and block rate. Anything moving down gets a cause written next to it immediately.
- Minute 4-7: Delivery and read rate, split utility versus marketing, against your own last four weeks — not against an industry benchmark.
- Minute 8-11: Cost per qualified reply for every campaign that ran, ranked. Kill the bottom one.
- Minute 12-15: Window utilisation and first-response time. If windows are expiring unused, that is next week's easiest win.
Write one sentence per section and move on. The value is in the consistency, not the depth. A team that looks at five numbers every Monday will beat a team that builds a beautiful dashboard once and never opens it.
Getting these numbers without building a data team
None of the above requires a warehouse or a BI contractor. It requires that your platform records delivery and read status per message, tags every send with its category, and lets you export the raw rows when you want to do your own arithmetic. If your current setup cannot tell you cost per qualified reply by campaign, that is a reporting gap worth fixing before you spend more on sends.
RichAutomate keeps this reporting on by default with usage-only pricing — ₹0 setup and ₹0 monthly platform fee, so the dashboard costs nothing to switch on and you pay only for the messages you actually send. You can start free and see your own delivery and reply numbers within a day of connecting your number, or read the full WhatsApp Business API pricing for Indian teams before you decide. Either way, pick your five metrics this week and delete the rest of the dashboard — the clarity is worth more than the charts you lose.